
-- Fidelity's Active Funds Pull Ahead In Disruptive 12-Month Period
Past Viewpoints:Gold / Oil Ratio Remains Stubbornly High
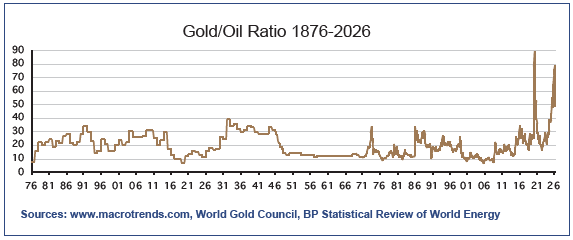
Over the last 150 years (almost as long as oil has played a role in powering the industrial age), an ounce of gold would buy about 20 barrels of oil on average. While the ratio has fluctuated significantly over the decades, 80% of the time it has remained between 10 and 30. If it dipped below 10, it generally signaled that gold was cheap – priced too low to adequately hedge the inflationary risks of relatively expensive oil. And when it surged above 30, it implied that oil was cheap – priced too low to fully compensate for the difficulty of locating and extracting it.
Over the last 50 years, with much of the world’s easy oil running out, and the industry turning to the more challenging deep water and shale extraction methods, the ratio remained below 30 about 98% of the time, making high readings relatively rare. The highest and longest-lasting spike was due to the pandemic, which created a huge short-term imbalance due to a plunge in oil demand at a time when government debt surged.
More recently, beginning in 2024, the indicator has revisited sky-high levels for reasons that are less explainable. While the war with Iran has caused a partial reversion, the ratio remains at an unusually high level. There are three possible explanations for this: (1) Gold is overvalued, (2) Oil is undervalued, or (3) Something has changed to render the indicator obsolete. Let’s examine each possibility.
Gold Is Overvalued
The 2024-2025 runup in gold coincides with the BRICS nations effort to create a non-dollar reserve currency based largely on gold. Central banks in the member countries – led by China – have been aggressively selling dollars and buying gold (China has also been buying 80-90% of Iran’s oil exports to help fill a gargantuan strategic oil reserve equal to four months domestic demand, which dwarfs the combined capacity of strategic oil reserves in Western countries). After about two years of strong central bank demand, the price of gold climbed enough to attract the attention of individual investors, who proceeded to join in, adding to the precious metal’s momentum. Only recently has there been any sign of a long-term peak.
Gold bulls would argue that the precious metal mainly represents protection against the huge increase in sovereign debt that underpins the world’s major fiat currencies. Given that returning the gold/oil ratio to a “normal” level of 30 would require the precious metal to tumble to around $3000 an ounce, they may be right. A decline of that magnitude would probably only happen if the U.S., China, Japan and most European countries were to start generating budget surpluses and reversing the buildup of sovereign debt. That’s not an impossible task, as it was briefly achieved by some countries roughly 25 years ago. But in today’s global economy it is probably out of the question.
Oil Is Undervalued
It is estimated that domestic energy companies burned through $300 billion in capital in the rush to create the U.S. shale oil industry between 2011-2021. While the industry is now cash flow positive, it is still recovering the cost of achieving U.S. energy independence. Part of the problem has been relatively cheap natural gas prices (for the same amount of energy content, natural gas usually sells at a 75-80% discount to oil because it is easier to produce and more difficult to export). Building LNG export terminals has improved the situation for producers, but over the last 15 years natural gas has become a heavy lifter in the global economy, and to some degree its lower energy cost has weighed down the price of oil (which has lagged inflation over the same period even at today’s prices).
The counter-argument here is that to bring the gold/oil ratio down to 30 (without any help from gold) would require oil to climb to $145. A move like that would force central banks to tighten, pushing up interest rates and throwing the global economy into a tailspin. When a commodity price gets high enough to force the world to live on less, it is not undervalued by definition.
The Ratio Itself Is No Longer Relevant
Despite its 10-30 range through a 150-year period involving major wars, periods of high and low sovereign debt, deflation, inflation, and various gold standards, we may be entering a period where the indicator is no longer predictive, meaning it doesn’t tell us anything we don’t already know. Gold, having no intrinsic value, is free to track the unprecedented rise in sovereign debt, while oil gets displaced by lower-cost LNG - the carbon-light fuel of choice for powering the global economy and an increasingly electric transportation system.
The counterpoint here is that sooner or later sovereign debt must either be monetized or fully serviced by tax revenue (or some combination of both). The monetization (money printing) solution seems increasingly likely, and in the age of AI it may turn out to be less inflationary than many gold bulls expect. Likewise, with oil’s role in the global economy shrinking somewhat slower than the depletion rate of shale oil wells, at some point its price may have to rise significantly to attract E&P capital at a time when AI inferencing and electricity generation are dominating the debt markets.
Most Likely Scenario / Sector Positioning
Even before the build-up to the war with Iran, there has been some evidence that a global rally in commodities is taking hold – driven mainly by the energy transition and the AI datacenter construction boom. It is reasonable to expect this to continue. But gold, having already experienced a large runup for reasons that have nothing to do with industrial demand, now seems poised to lag other commodities going forward, including oil. Much like its 1980-2000 performance, this inflation-lagging behavior could span more than a decade. As for oil, the possibility exists that it will settle into a significantly higher range even after the war ends. While we have not yet included any energy or commodity exposure in our sector model (our recent changes aim to reduce risk and boost exposure to AI infrastructure), those options could make sense down the road.
First Quarter Review
Higher oil and LNG prices (due to the war on Iran), along with rising bond yields, were the main thing that weighed on stocks during the first three months of the year. But the disruptive potential of AI technology – which included new and unexpected developments allowing AI models to run more efficiently on a wider range of hardware platforms – had negative effects on many software and financial companies, as well as some chipmakers. On the other hand, the impact of ongoing government shutdowns and the Supreme Court ruling on tariffs – which prompted a shift by the Trump administration to alternate tariff statutes with less flexibility – were largely shrugged off by investors. For the quarter, the S&P 500 finished with a loss of 4.3%.
Despite higher yields, bond investors don’t seem too worried about the inflationary effects of higher energy costs, perhaps because the deflationary effects of AI technology have potential to provide an offset. While the 5-year breakeven rate (annualized expectation for inflation) rose to 2.5%, up from about 2.3% at the start of the year, the 10-year breakeven rate was largely unchanged remaining at around 2.3%. Still, with price declines offsetting yields, the U.S. Aggregate Bond Index finished flat for the quarter.
On the stock side, our sector holdings declined in line with the S&P 500, while our diversified fund holdings held up better than the broad index. On the bond side, our continuing focus on intermediate and short-maturity bonds allowed us to finish close to breakeven in most cases, with our most conservative bond mix logging a small gain.
Looking Ahead
It may take several quarters for oil and LNG prices to come down, and there is some risk that crude could settle at a permanently higher post-war level. While domestic consumer spending is negatively affected by elevated gasoline, diesel and jet fuel prices, higher tax refunds from the new tax code have the potential to provide at least a partial offset. Another positive is that domestic natural gas prices are low and stable because of prolific supplies. These departures from energy crises of the past should keep inflation and GDP effects moderate this time around.
However, many foreign economies could get hit hard. And because some 40% of S&P 500 revenue comes from outside the U.S., beginning-year forecasts for robust corporate earnings in 2026 may not necessarily pan out. But with AI technology remaining a key factor, and with the recent developments that expand the options and reduce the cost of hardware needed for running AI models and agents, there may still be a path for results to exceed expectations. Some of our recent portfolio moves have added exposure to mid-cap stocks, which aren’t as expensive as large-caps and represent a bright spot on the earnings front. These stocks are somewhat less exposed to a potential slump in foreign earnings, so if the global energy situation takes a long time to resolve we may add to our existing positions.
Sector-wise, our recent series of moves aims to reduce overall portfolio risk and move closer to S&P 500 weightings, while positioning our industrial and biotech holdings as major overweights. We see these groups having potential to gain from the AI revolution, with industrials also benefitting from any increased energy transition spending. While we’ve decided against any direct bets on energy or commodities at this time, both remain future options depending on how the global energy situation evolves.
On the bond side, today’s elevated yields could turn out to be a temporary situation, but with borrowing demand potentially rising, there is also some risk of even higher rates. Since our short-to-intermediate bond positions are giving up only a small amount of yield relative to the long end of the curve, while keeping interest-rate sensitivity at far lower levels, we are hesitant to alter our current positioning.
Sincerely,

Jack Bowers
President & Chief Investment Officer